Enhanced coagulation drives plant efficiency and performance
The Challenge
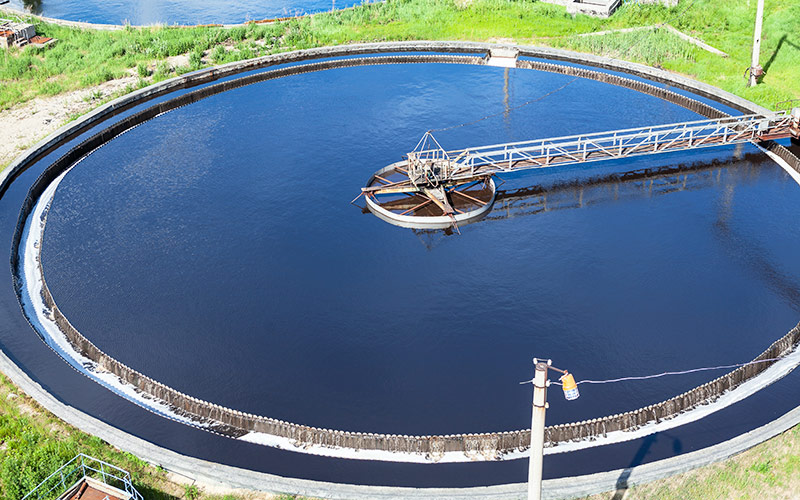
A 770,000 GPD municipal wastewater treatment plant discharging to a stream leading to Lake Erie was having difficulty meeting its total aluminum (1.1 mg/L) and total phosphorus (1.0 mg/L) permits. After months of dosing 60 ppmv of either ferric chloride or PAC prior to the secondary clarifier, the plant was unable to meet its permit limits. Attempts to meet t he permit by increasing the dosage rate of either coagulant were unsuccessful. When higher doses of ferric chloride were attempted, buried chemical feed lines corroded, leading to expensive repairs. Higher doses of PAC caused aluminum concentrations in the final effluent to exceed the plant’s aluminum permit. Since t he plant was running out of options, plant management decided to conduct a full-scale trial with NeoWaterFX100.
Trial Overview and Results
The plant process is shown in Figure 1. NeoWaterFX100 was dosed into both the primary and secondary clarifiers beginning October 2014.
Figure 1: Plant Process Diagram
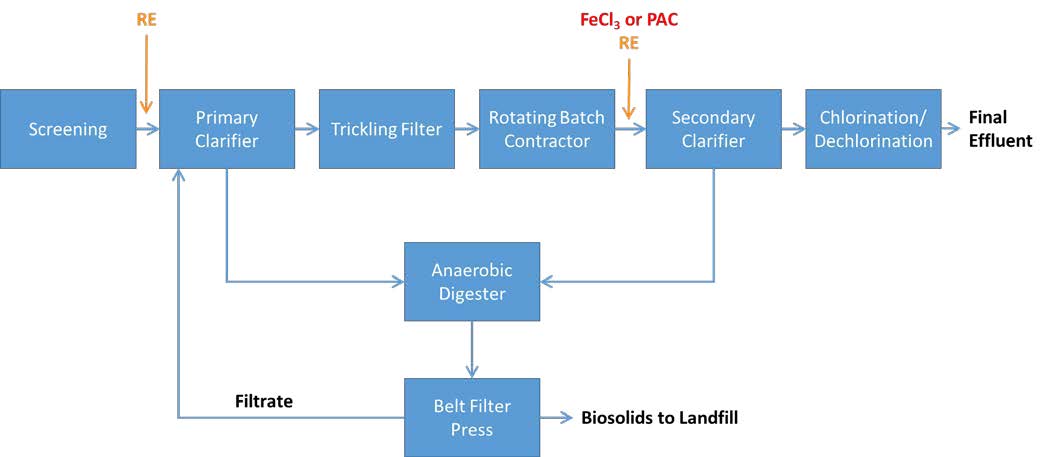
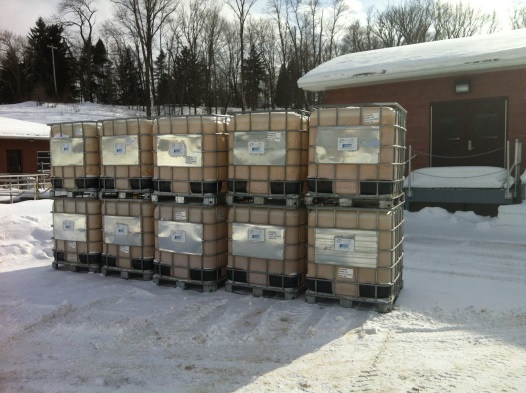
Figure 2. NeoWaterFX100 totes awaiting use in the trial on a -25°F day
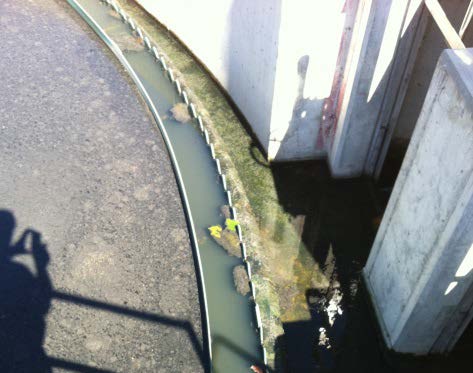
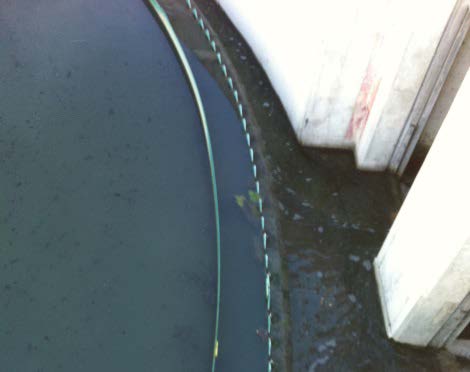
Prior to the trial, the clarifiers did a poor job of settling solids. To improve solids removal in the primary clarifier, 16 ppmv of NeoWaterFX100 was added. In the secondary clarifier, 100 ppmv of NeoWaterFX100 was added to improve settling and to bring the phosphorus and aluminum quickly into compliance. Figure 3 below shows how the secondary clarifier’s appearance improved after 48 hours of NeoWaterFX100 dosing.
As shown in Figures 4(a) and 4(b), on the following page, NeoWaterFX100 successfully reduced phosphorus within the first month to meet permit limits. After only four days of NeoWaterFX100 dosing, the phosphorus dropped from 1.5 ppm TP to below 0.5 ppm TP.
PAC addition caused the aluminum in the effluent to rise dramatically over that of the influent (left half of Figure 4(a)). After one month of trial usage, the plant decided to switch over to NeoWaterFX100. The plant is now using NeoWaterFX100 exclusively to meet their TP and Al discharge permits. After several months of usage, plant management was able to optimize the process and reduce the total NeoWaterFX100 dose in both clarifiers to 70 ppmv. Plant personnel a re continuing to optimize and have reduced the dosage to even lower levels.
Figures 4(a) and 4(b): Total Phosphorus and Total Aluminum Before and After NeoWaterFX100
-
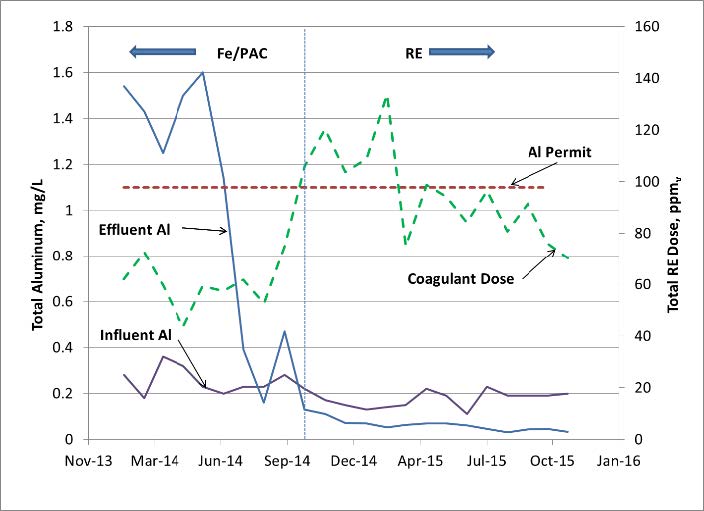
- Figure 4(b). Total Aluminum before and after NeoWaterFX1100
-
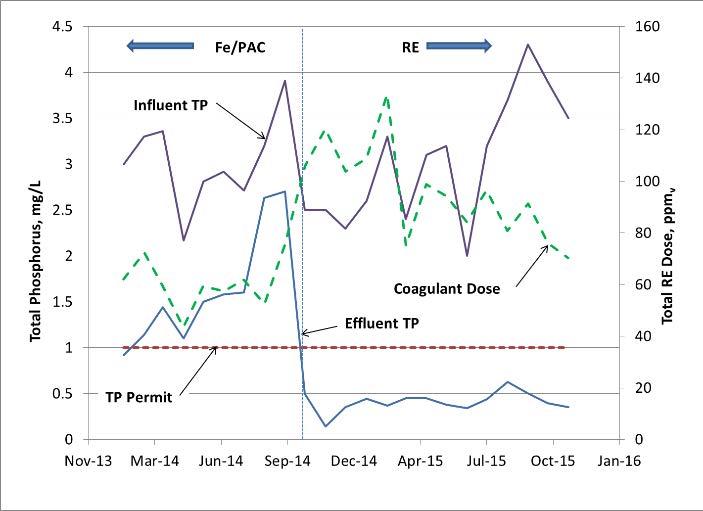
- Figure 4(a). Total Phosphorus before and after NeoWaterFX100
Additional Benefits Observed
It was clear that more biosolids were removed as the clarifiers’ performance improved. This positively impacted sludge volumes and sludge belt filter press/dewatering operations. Sludge wasting, filter press cake solids, and polymer pump speed are shown in Table I below. With NeoWaterFX100, the plant wasted 27% less total sludge by volume, filter press cake solids increased by 34%, and the polymer pump speed was reduced by 9%. As waste sludge density increases, less water is sent to the digester and the belt filter press, which leads to less polymer needed for dewatering as well as a dryer belt filter press cake. Electricity usage is also expected to decline because the clarifier sludge blankets aredenser, and the sludge wasting pumps now run less frequently than before.
Table I. Solids handling results
| Parameter | Ferric Chloride/PAC | NeoWaterFX100 | % Change |
| Primary sludge wasted, gal/MG | 3,070 | 2,500 | -19% |
| Secondary sludge wasted, gal/MG | 5,510 | 1,540 | -37% |
| Total sludge wasted, gal/MG | 5,510 | 4,040 | -27% |
| Filter press cake solids, % solids | 15.7% | 21.1% | 34% |
| Polymer pump speed | 67 | 52 | -9% |
Better coagulation led to improvements in other plant process parameters, as shown in Table II below. With NeoWaterFX100, BOD, ammonia, and fecal coliform removals were higher, and sludge landfill costs on a $-per-dry-solids-basis were 25% lower. The plant also noticed that the rotating batch contactor (RBC) blowers are activated less frequently, which results in lower electricity usage. Lower BOD, in particular, may contribute to less growth on the RBCs, reducing the air flow needed to slough off excess biomass.
Table II. Other benefits observed
| Parameter | 135.3 | 112.8 |
| Inlet BOD, mg/L | 110 | 0 |
| Outlet BOD, mg/L | 11.4 | 4.9 |
| BOD Reduction, % | 91.6% | 95.6% |
| Inlet Ammonia, mg/L | 13.2 | 14.3 |
| Outlet Ammonia, mg/L | 1.4 | 0 |
| % Ammonia Reduction | 89.4% | 93.0% |
| Fecal coliform, cfu | 19.7 | 6.3 |
| Disposal Cost, $/wet ton sludge | $102.90 | $102.90 |
| Disposal Cost, $/dry ton solids | $655 | $488 |
Conclusion
NeoWaterFX100 dramatically improved solids settling in the plant’s clarifiers, which positively impacted plant efficiency and performance. Since October 2014, this plant has been in total compliance with its NPDES discharge permits. The higher solids content in the belt filter press cake and reduced polymer usage has allowed the plant to lower its per-unit costs of dry solids disposal. The plant is continuing to optimize the process and quantify reduced electricity usage to determine additional cost savings.
 Request a Consult button.")